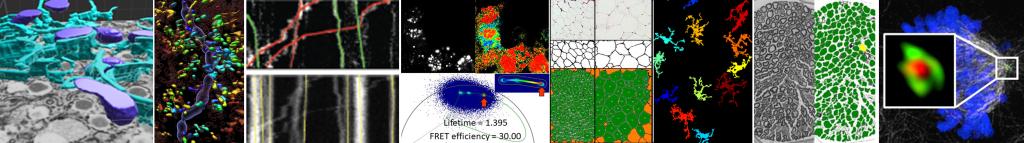
Three-Dimensional Morphometric Analysis/Imaris
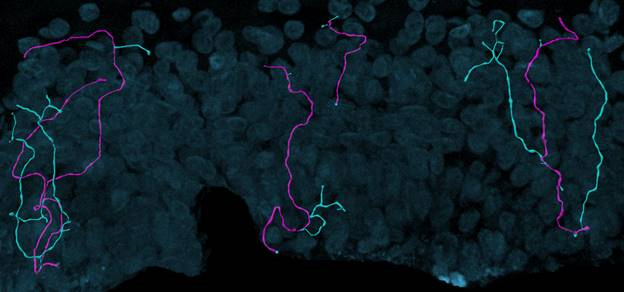
Three-Dimensional Measurements of Intraepidermal Nerve Fiber
 Click on the image to view full size.
Fluorescent z-series images were collected on the Leica SP5 confocal microscope (nuclei of keratinocytes are shown as cyan). Intraepidermal nerve fibers (magenta) and branches (cyan) were rendered in 3D and measured with Imaris software. Alexandra Münch, Nicholas Rebhan & Eva L. Feldman, MD PhD Department of Neurology.
Three-Dimensional Distance Measurements of Mitochondria near Nerve Fibers/Imaris
 Click on the image to view full size.
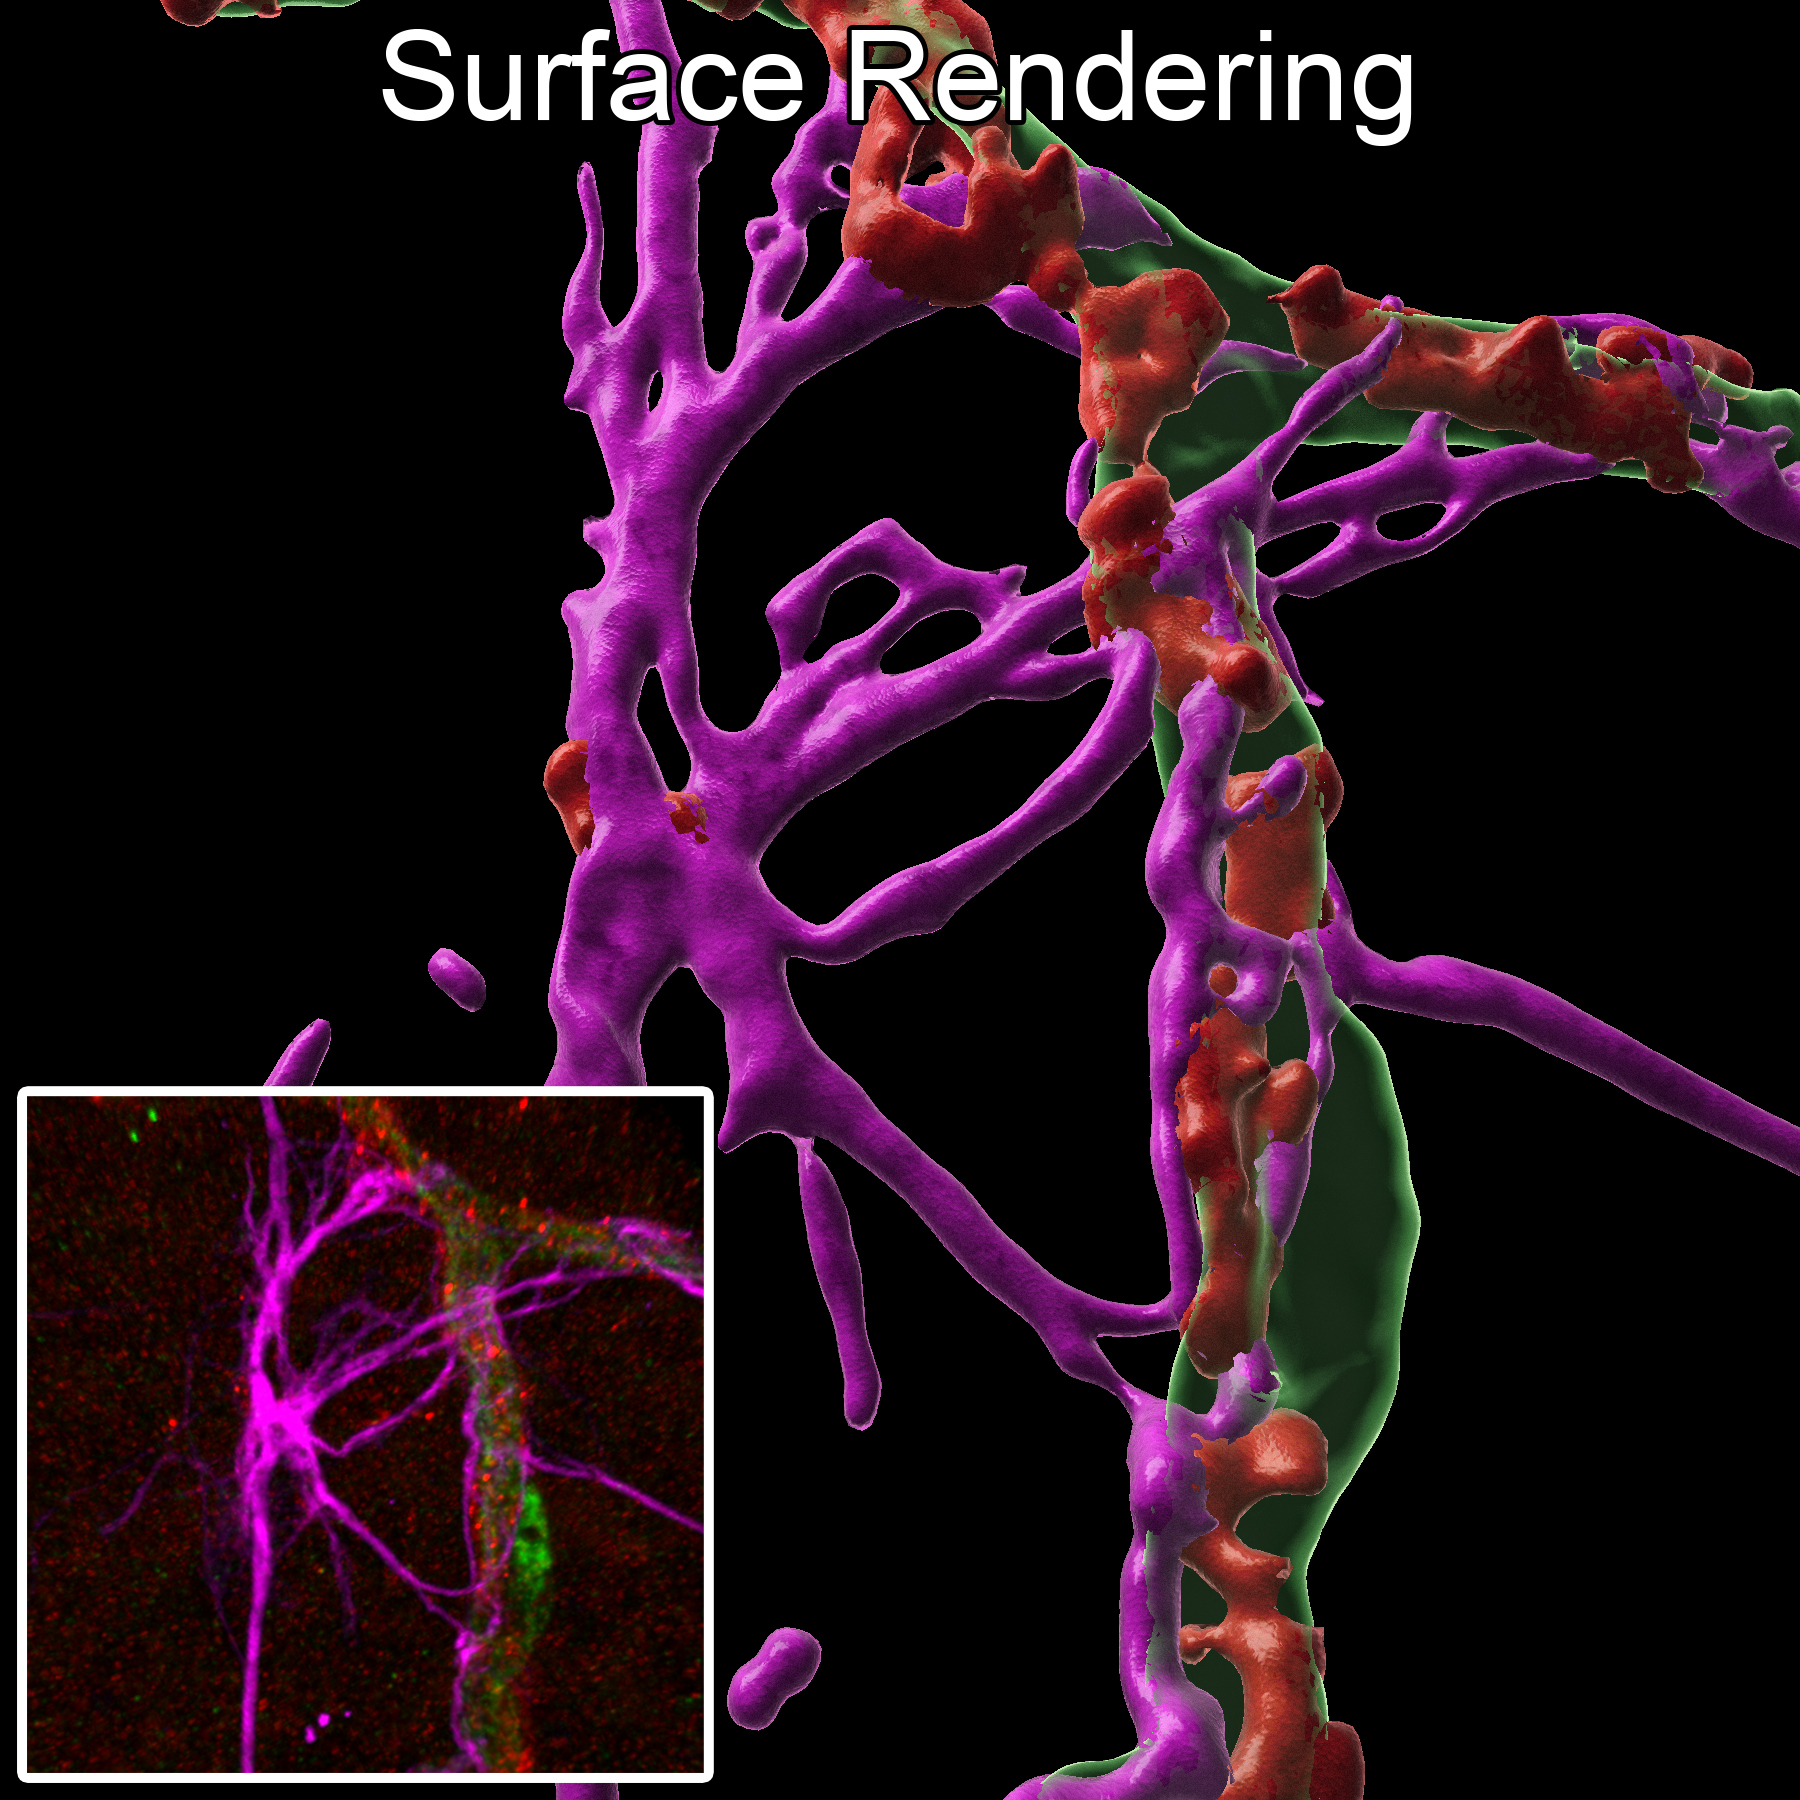
Fluorescent z-series images were collected on the Nikon A1 confocal microscope (inset of the image, nerves green, mitochondria red). Surfaces of intraepidermal nerve fibers (translucent violet) and mitochondria (translucent red and colored-coded by distance from nerve surface up to 5 µm away) were rendered in 3D and measured with Imaris software. John, M. Hayes & Eva L. Feldman, MD PhD Department of Neurology, Stephen I. Lentz, Laboratory Director of Imaging of the MIAC.
Three-Dimensional Surface Rendering of Retinal Vasculature/Imaris
 Click on the image to view full size.
Fluorescent z-series images were collected on the Stellaris 8 confocal microscope (inset of the original fluorescence image). Surface renderings were made in Imaris to show the retinal vasculature, tight junctions, and associated cells. Xuwen Liu, PhD and David Antonetti, PhD, Department of Ophthalmology and Visual Sciences.
Morphometric Analysis/MetaMorph
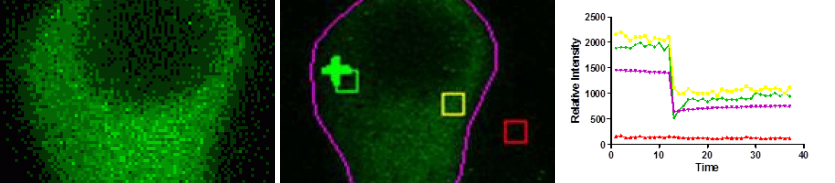
Fluorescence Recovery After Photo Bleaching
 Click on the image to view full size.
Time series images were taken on the Olympus FV500 confocal microscope. The fluorescent signals within the regions of interest of the bleached area (green), adjacent to the bleached area (yellow), whole cell (magenta) or outside the cell (red) were measured over time with MetaMorph software. Cells expressing green fluorescent markers were provided and imaged by Stephen A. Ernst, PhD, Department of Cell and Developmental Biology and Edward L. Stuenkel, Department of Molecular and Integrative Physiology.
 Click on the image to view full size.
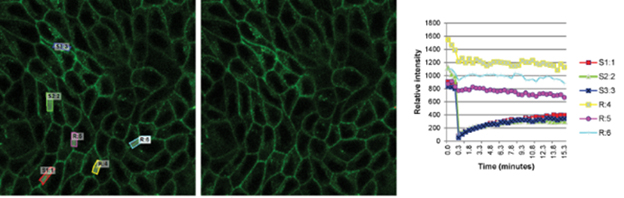
Time series images were taken on the Leica SP5 confocal microscope. The fluorescent signals within the regions of interest of the bleached area (S1:1 red, S2:2 green, and S3:3 blue) and away from the bleached area (R:4 yellow, R:5 magenta, and R:6 cyan were measured over time with MetaMorph software. Madin-Darby canine kidney (MDCK) epithelial cells expressing green fluorescent markers were provided and imaged by Mark T. Bolinger, PhD, and David A. Antonetti, PhD, Department of Ophthalmology and Visual Sciences.
Mitochondria Trafficking
 Click on the image to view full size.
 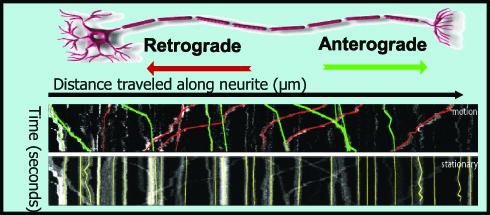 Click on the image to view full size.
Time series images were taken on the Nikon A1 confocal microscope. Mitochondria were labeled with a fluorescent signals in murine primary sensory neurons. Mitochondria trafficking in neurites was done with kymograph analysis using MetaMorph software. Primary sensory neuron cultures were provided and imaged by Amy Rumora, Eva L. Feldman, MD PhD, Department of Neurology and Stephen I. Lentz, PhD, Laboratory Director of Imaging, MIAC.
G-ratio Measurements in Mouse Seral Nerve
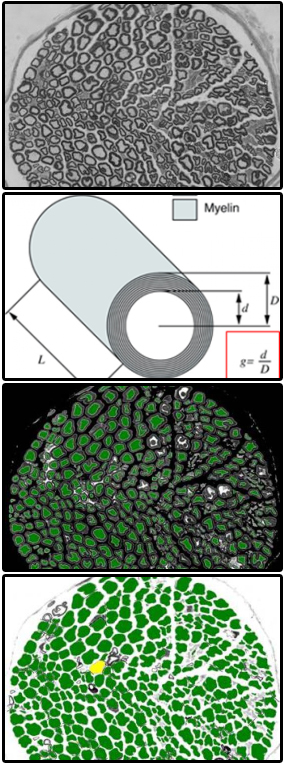 Click on the image to view full size.
G-ratio (the ratio of the inner axonal diameter to the total outer diameter) is a highly reliable ratio for assessing axonal myelination. TEM images were analyzed with MetaMorph Software by John M. Hayes, BS, Andrew Solway, Lucy M. Hinder, PhD, and Eva L. Feldman, MD, PhD, Department of Neurology.
Adipocyte Measurements
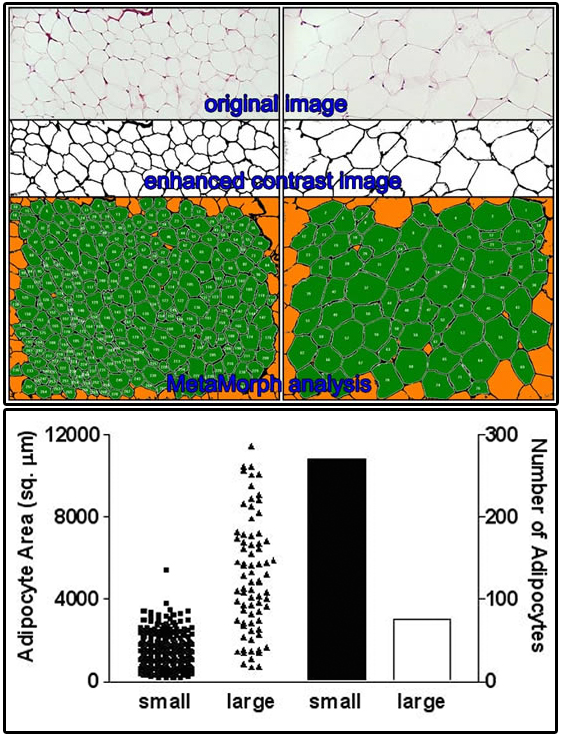 Click on the image to view full size.
Original images were collected on a Nikon microscope. Image contrast was enhanced with PhotoShop. Adipocyte area and number were measured with MetaMorph software and data was plotted with Prism software by Tyler C. Prestwich, Sebastian D. Parlee, PhD and Ormond A. MacDougald, PhD Department of Molecular and Integrative Physiology.
Morphometric Analysis/MATLAB
Microglia Activation Analysis
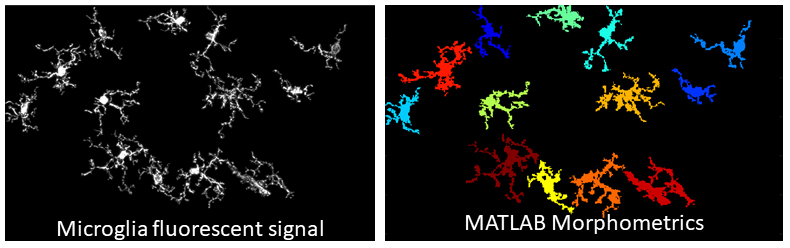 Click on the image to view full size.
Original images were collected on a Nikon A1 or Leica Stellaris 8 confocal microscope. Images were pre-processed with Imaris to remove fragmented microglia and then analyzed with MATLAB software using the 3DMorph Script by York et al., eNeuro (2018) Dec 10;5(6) e0266-18.2018 1–12. Rosie Henn, PhD and Eva L Feldman, MD PhD, Department of Neurology.
Aivia: Artificial Intelligence-Based Software
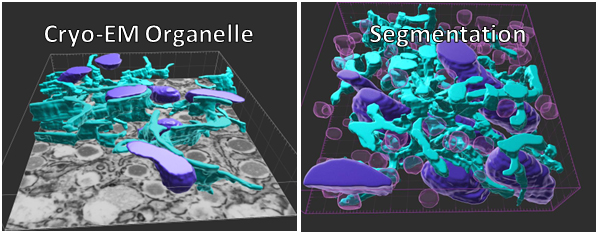 Click on the image to view full size.
Cryo-EM z-series images were collected and Aivia software was used to identify intracellular organelles of the endoplasmic reticulum (teal) and mitochondria (violet). (nuclei of keratinocytes are shown as cyan). Intraepidermal nerve fibers (magenta) and branches (cyan) were rendered in 3D and measured with Imaris software. Alexandra Münch, Nicholas Rebhan & Eva L. Feldman, MD PhD Department of Neurology.