Nikon A1 Images
Islets in human pancreas tissue section
 Click on the image to view full size.
A 26x29 XY array was taken with a 10x objective on the Nikon A1 confocal microscope and stitched together with Nikon Elements software. This 10x map was used to identify islets that were taken with a 40x oil objective. Stained and imaged by Leena Haataja, PhD and Peter Arvan, MD, PhD, Department of Internal Medicine, Division of Metabolism, Endocrinology and Diabetes.
Mitochondrial Trafficking in Sensory Neurons
 Click on the image to view full size. Time series images were taken on the Nikon A1 confocal microscope. Mitochondria were labeled with a Mito-RFP baculovirus in murine primary sensory neurons. Primary sensory neuron cultures were provided and imaged by Amy Rumora, Eva L. Feldman, MD PhD, Department of Neurology and Stephen I. Lentz, PhD, Laboratory Director of Imaging, MIAC.
Live 3D Imaging of Adipose Tissue
 Click on the image to view full size. Transgenic mice expressed a Rosa26--loxP-memTom-loxP—memGFP x Adiponectin-CRE. Adipose tissue was imaged in z-series on the Nikon A1 confocal microscope and rendered in 3D with Imaris software by Ziru Li, Brian Learman, BS, and Ormond A. MacDougald, PhD, Department of Molecular and Integrated Physiology.
Live Cell Imaging of the Ratiometric cSNARF-1AM pH Sensor
 Click on the image to view full size. Mouse embryonic fibroblasts preloaded with cSNARF-1-AM in media at neutral pH (7.4, pre-stimulation) increased their intracellular pH (pHi) when exposed to alkaline pH (8.3, post-stimulation). Experiments were done and imaged by Dubek Kazyken, PhD, Stephen Lentz, PhD and Diane Fingar, PhD, Department of Cell and Developmental Biology.
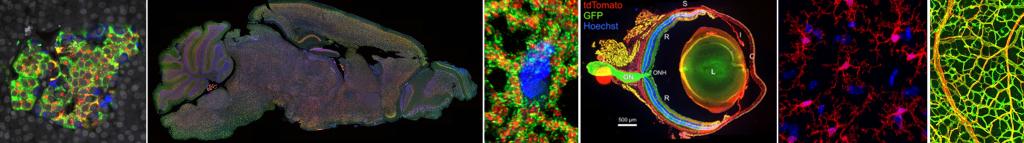
Stellaris 8 FALCON Images
Large Format Stitched Murine Ocular Section
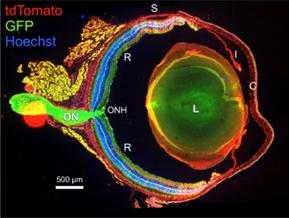 Section of eye from 10-week old mT/mG X Six3Cre mouse. Note complete recombination in the central regions of the retina (R) and optic nerve (ON) as indicated by expression of membrane-GFP and loss of membrane-tdTomato (RFP variant) expression. Also indicated: choroid (C), iris (I), lens (L), sclera (S) and optic nerve head (ONH). Images were taken in XY and stitched together with Leica Navigator by Sumathi Shanmugam and Steven Abcouwer, PhD, Department of Ophthalmology and Visual Sciences.
Large Format Stitched Retina Flat Mount
 Click on the image to view full size.Mouse flat mount retina stained for vasculature. Images were taken in XY and Z and stitched together with Leica Navigator by Andreia Goncalves, PhD and David Antonetti, PhD, Department of Ophthalmology and Visual Sciences.
Large Format Stitched Parasagittal Brain Section
 Click on the image to view full size. Mouse brain parasagittal section was stitched together from 320 images taken in XY with Leica Navigator by Mauricio Torres, PhD and Ling Qi, PhD, Department of Molecular & Integrative Physiology.
Lightning Deconvolution
 Click on the image to view full size. Endothelial Cell Junction Proteins. The before image represents the raw confocal image prior to Lightning deconvolution that is shown in the after image. Mónica Díaz-Coránguez, PhD and David Antonetti, PhD, Dept Ophthalmology & Visual Sciences.
 Click on the image to view full size. Mitochondria in adipose tissue stained with an outer membrane marker (green) and matrix marker (red). The before image represents the raw confocal image prior to Lightning deconvolution that is shown in the after image. Siwen Wang, PhD and Ling Qi, PhD, Department of Molecular & Integrative Physiology.
 Click on the image to view full size.Occludin S490 phosphorylation in centrosome in human osteosarcoma U2OS cells. Immunofluorescence staining using anti-phosphosite-specific antibody occludin pS490 (red), centrosome marker γ-tubulin (green), and hoechst nuclear staining dye (blue) in metaphase U2OS cells. The images were acquired on Leica SP5 (A) or SP8 confocal microscope (B) and processed by imaris image analysis software. Scale bars, 2 µm (middle panel), 0.5 µm (zoomed-in panel). Xuwen Liu, PhD and David Antonetti, PhD, Dept Ophthalmology & Visual Sciences.
FLIM-FRET Phasor Analysis
 Click on the image to view full size.
  Click on the image to view full size.
  Click on the image to view full size.
Laura Gonzalez Gonzalez, PhD, Stephen Lentz, PhD and David Antonetti replicated the published work of Drs. Jakub Harnoš and Vítězslav Bryja to demonstrate that Fluorescence Lifetime Imaging Microscopy- Förster Resonance Energy Transfer (FLIM-FRET) could be used to measure FRET efficiency. Leica FALCON software and Phasor analysis used to quantify FLIM-FRET of their Fluorescein Arsenical Hairpin Binder- (FlAsH-) based FRET biosensor to study conformational changes in dishevelled (DVL) in living cells.